

Market reports
The Grand housing market, updated every month
Each month I pull the numbers for The Grand straight from the MLS and explain what they mean in plain language, so buyers and sellers here can make decisions on current information instead of headlines about the national market.
October 2026 · Latest report
The Grand Market Update - October 2026
Last reviewed: November 3, 2026 · Data provided by ARMLS as of 11/03/2026
What these numbers cover: homes inside The Grand (Sun City Grand) community only, not all of Surprise or the entire ZIP code.
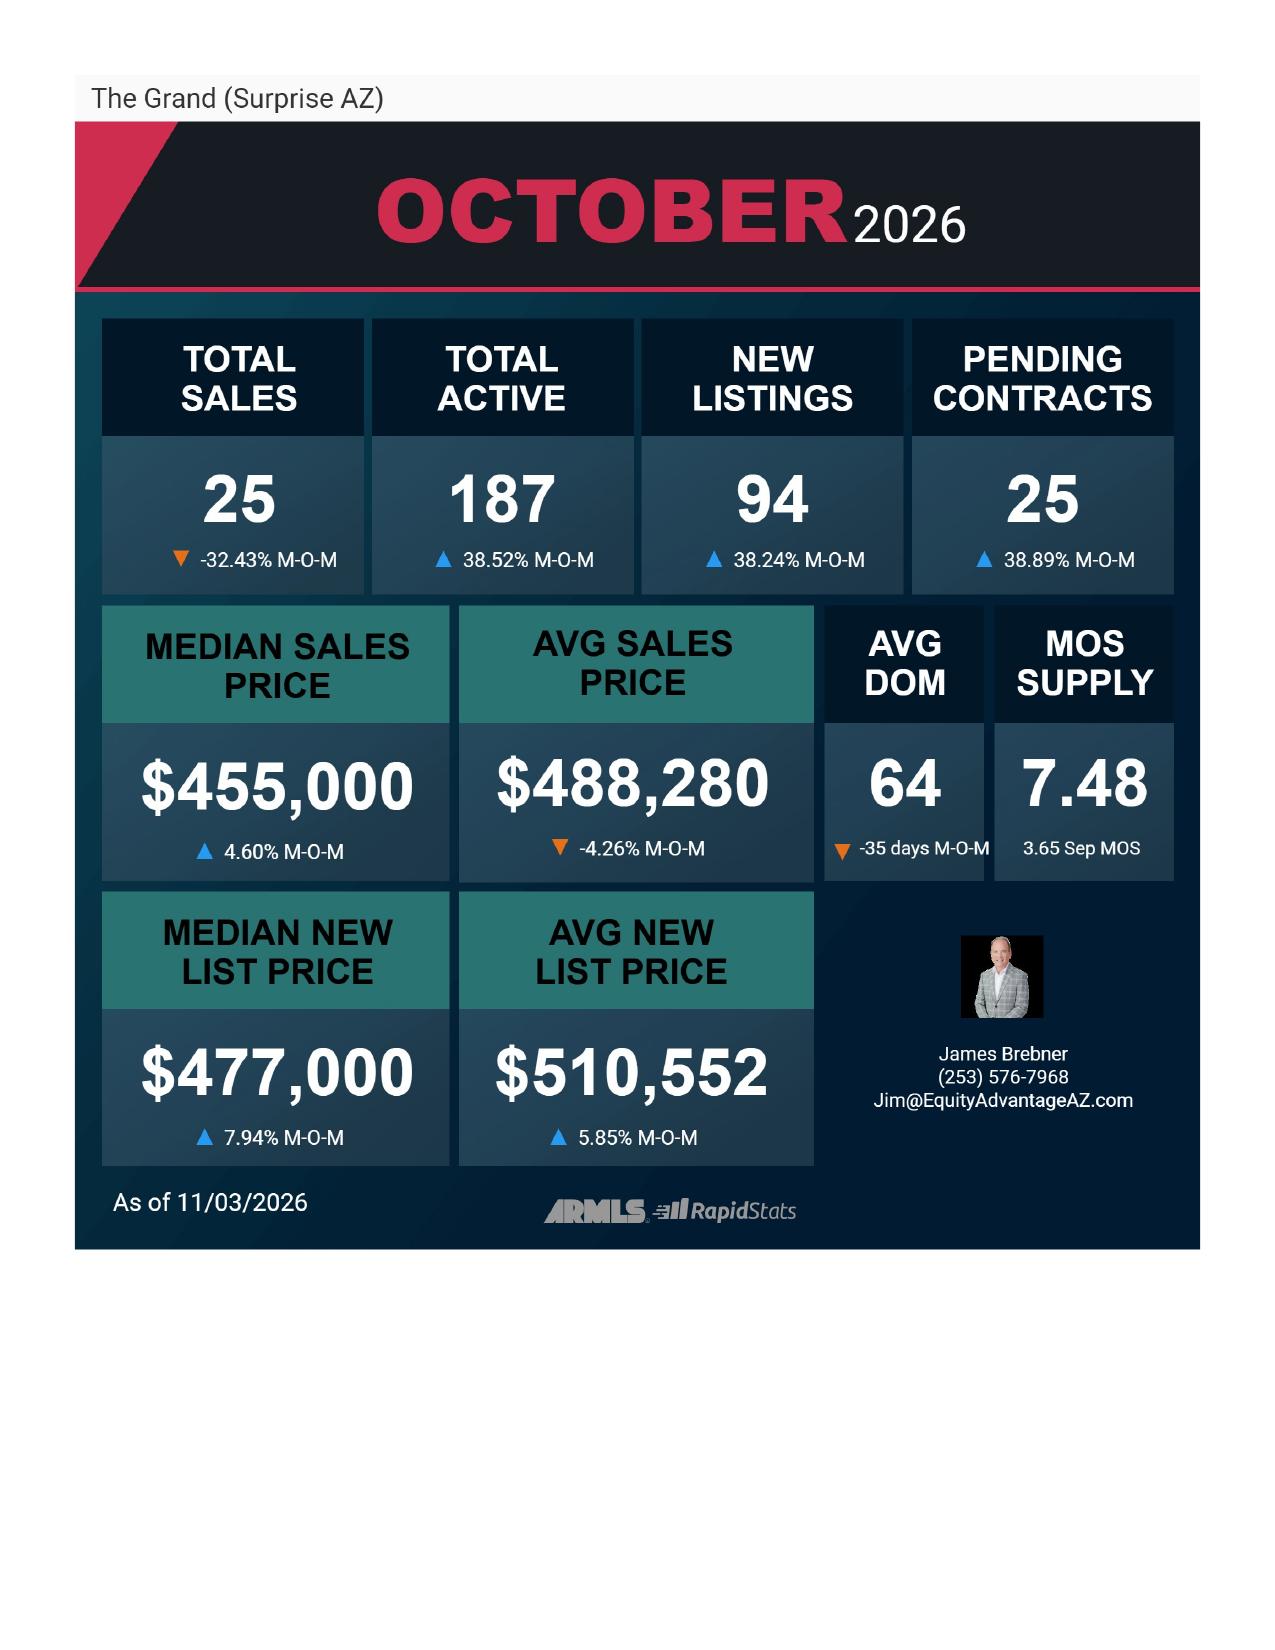
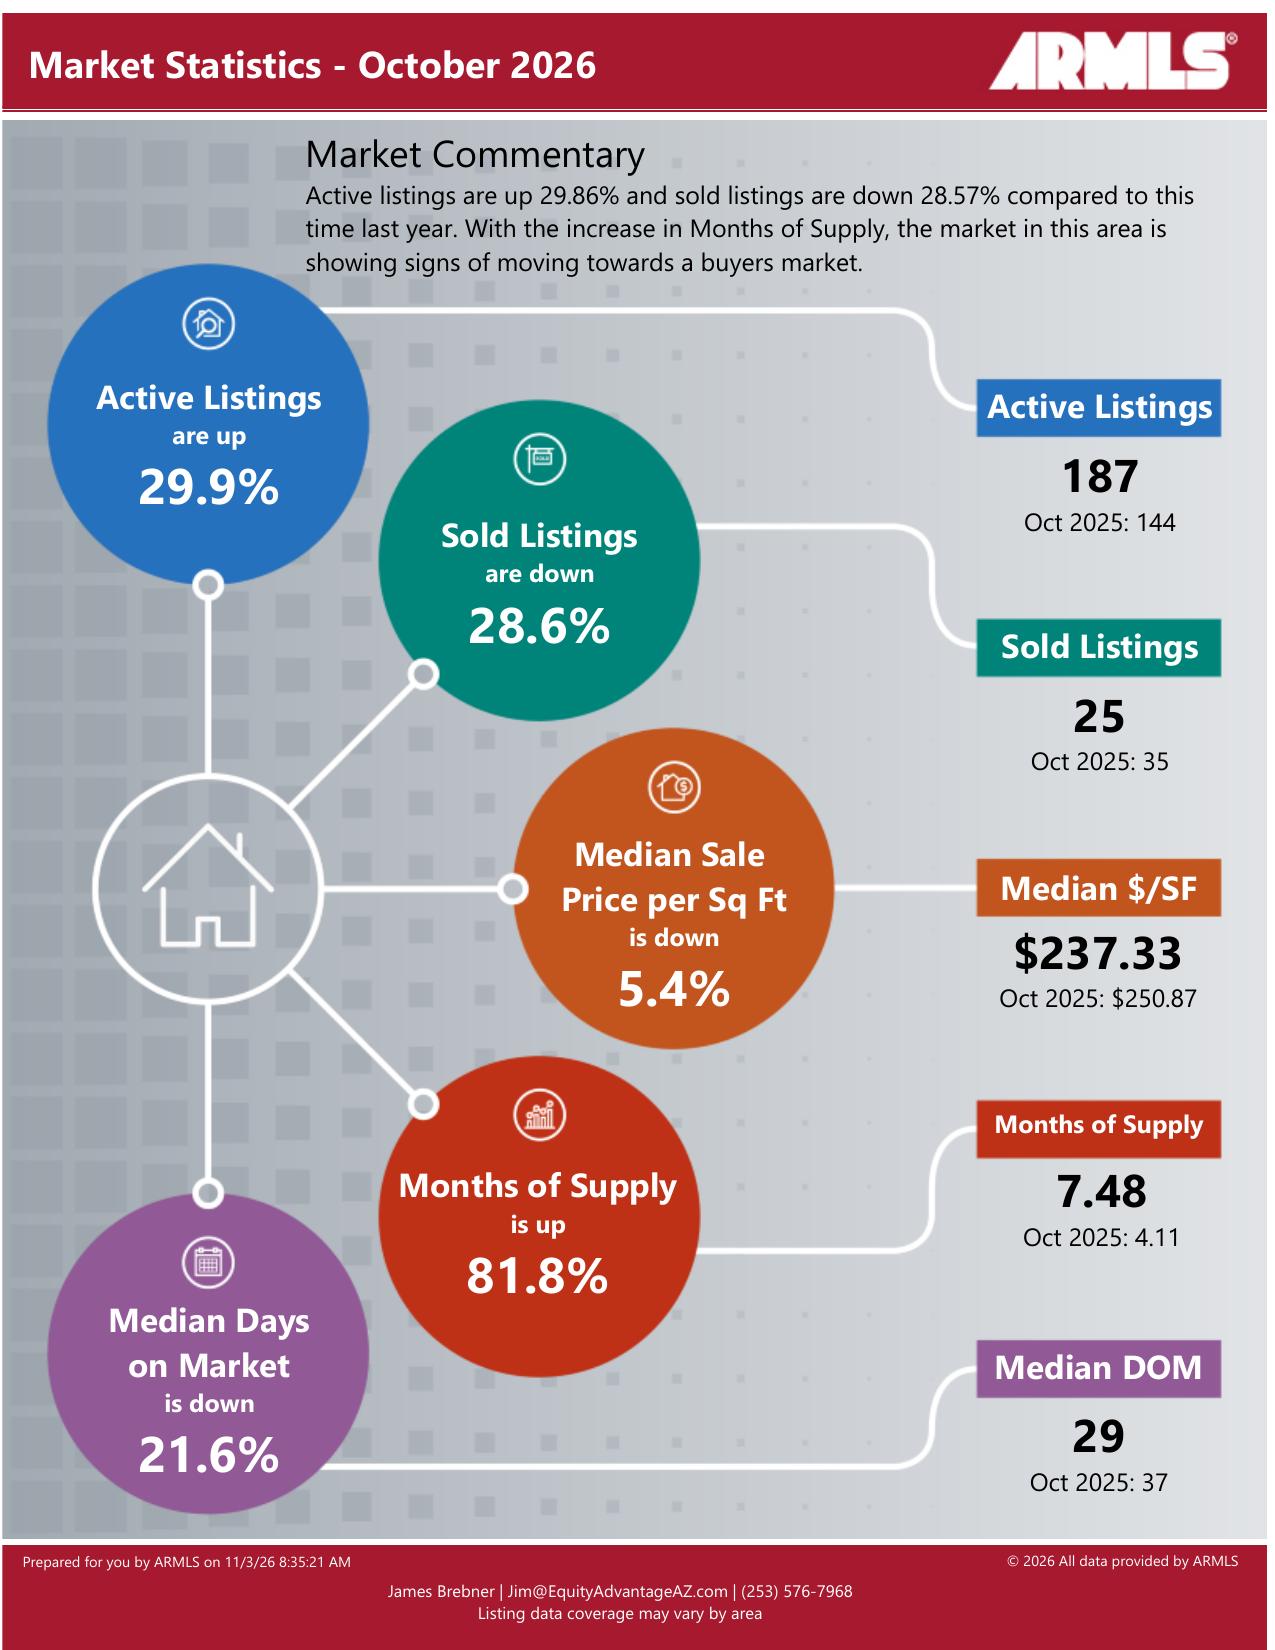
October ended with 187 active listings and 25 homes sold. Compared with October 2025, active listings rose 29.9% and sales fell 28.6%. Months of supply increased to 7.48, up from 4.11 a year earlier and 3.65 in September 2026.
The median sale price was $455,000, while the average was $488,280. The median price per square foot was $237.33, down 5.4% year over year. These figures describe the homes that sold during the month; they do not establish the value of an individual home.
Median days on market was 29, compared with 37 last October. The sales snapshot reports an average of 64 days. The median is the middle observation; the average can be affected by homes that took much longer to sell. Neither measures how long every currently listed home will take to find a buyer.
Report takeaway
The ARMLS report describes signs of a shift toward a buyer's market. More inventory and fewer closed sales give buyers more homes to compare. Sellers should evaluate their own floor plan, condition and current competition rather than rely on the community's median price alone.
Report provided by Jim Brebner, REALTOR® with Realty ONE Group. Figures are taken from ARMLS for The Grand in Surprise, Arizona and are deemed reliable but not guaranteed.
What is your home in The Grand worth today?
Ask me for a free, home-specific value review based on your floor plan, condition and the homes you would be competing against right now.
September 2026
The Grand Market Update - September 2026
Last reviewed: October 15, 2026 · Data provided by ARMLS as of 10/14/2026
What these numbers cover: homes inside The Grand (Sun City Grand) community only. They are not figures for all of Surprise or for the entire ZIP code.
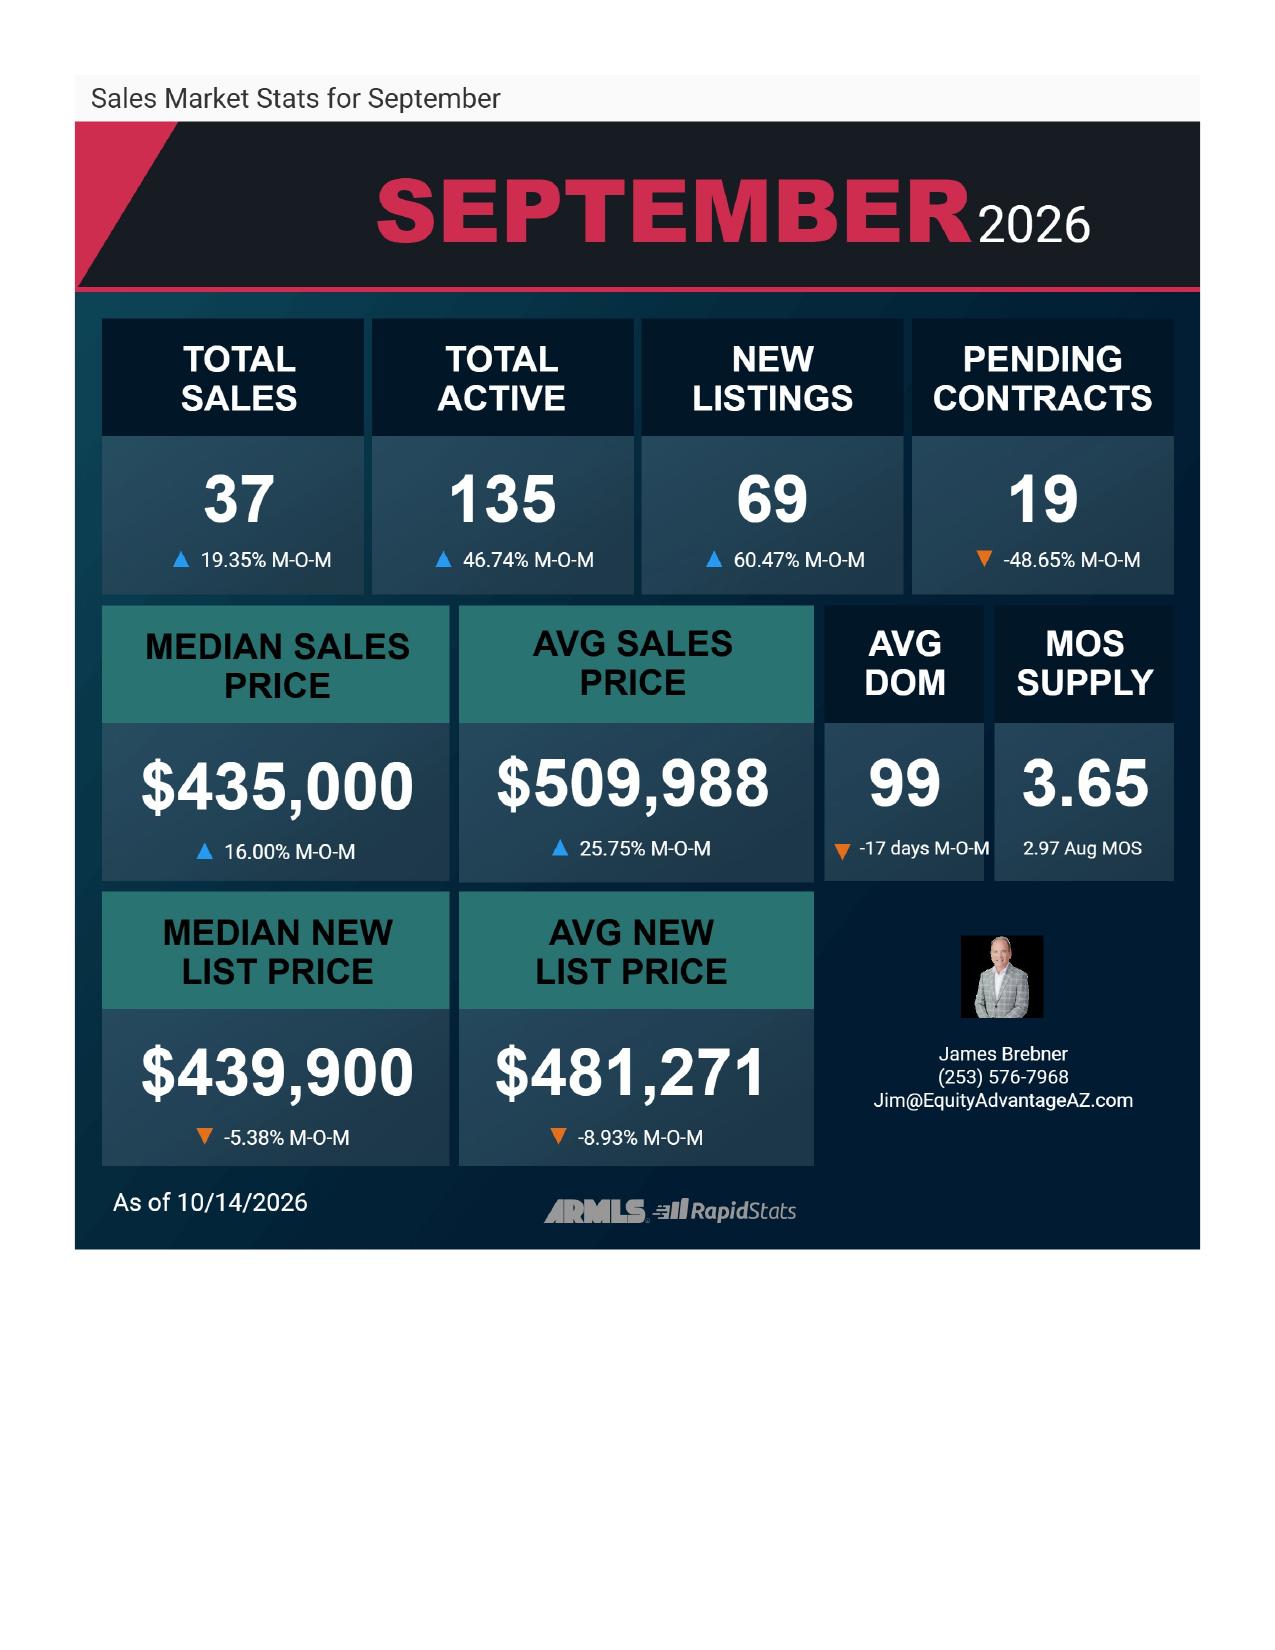
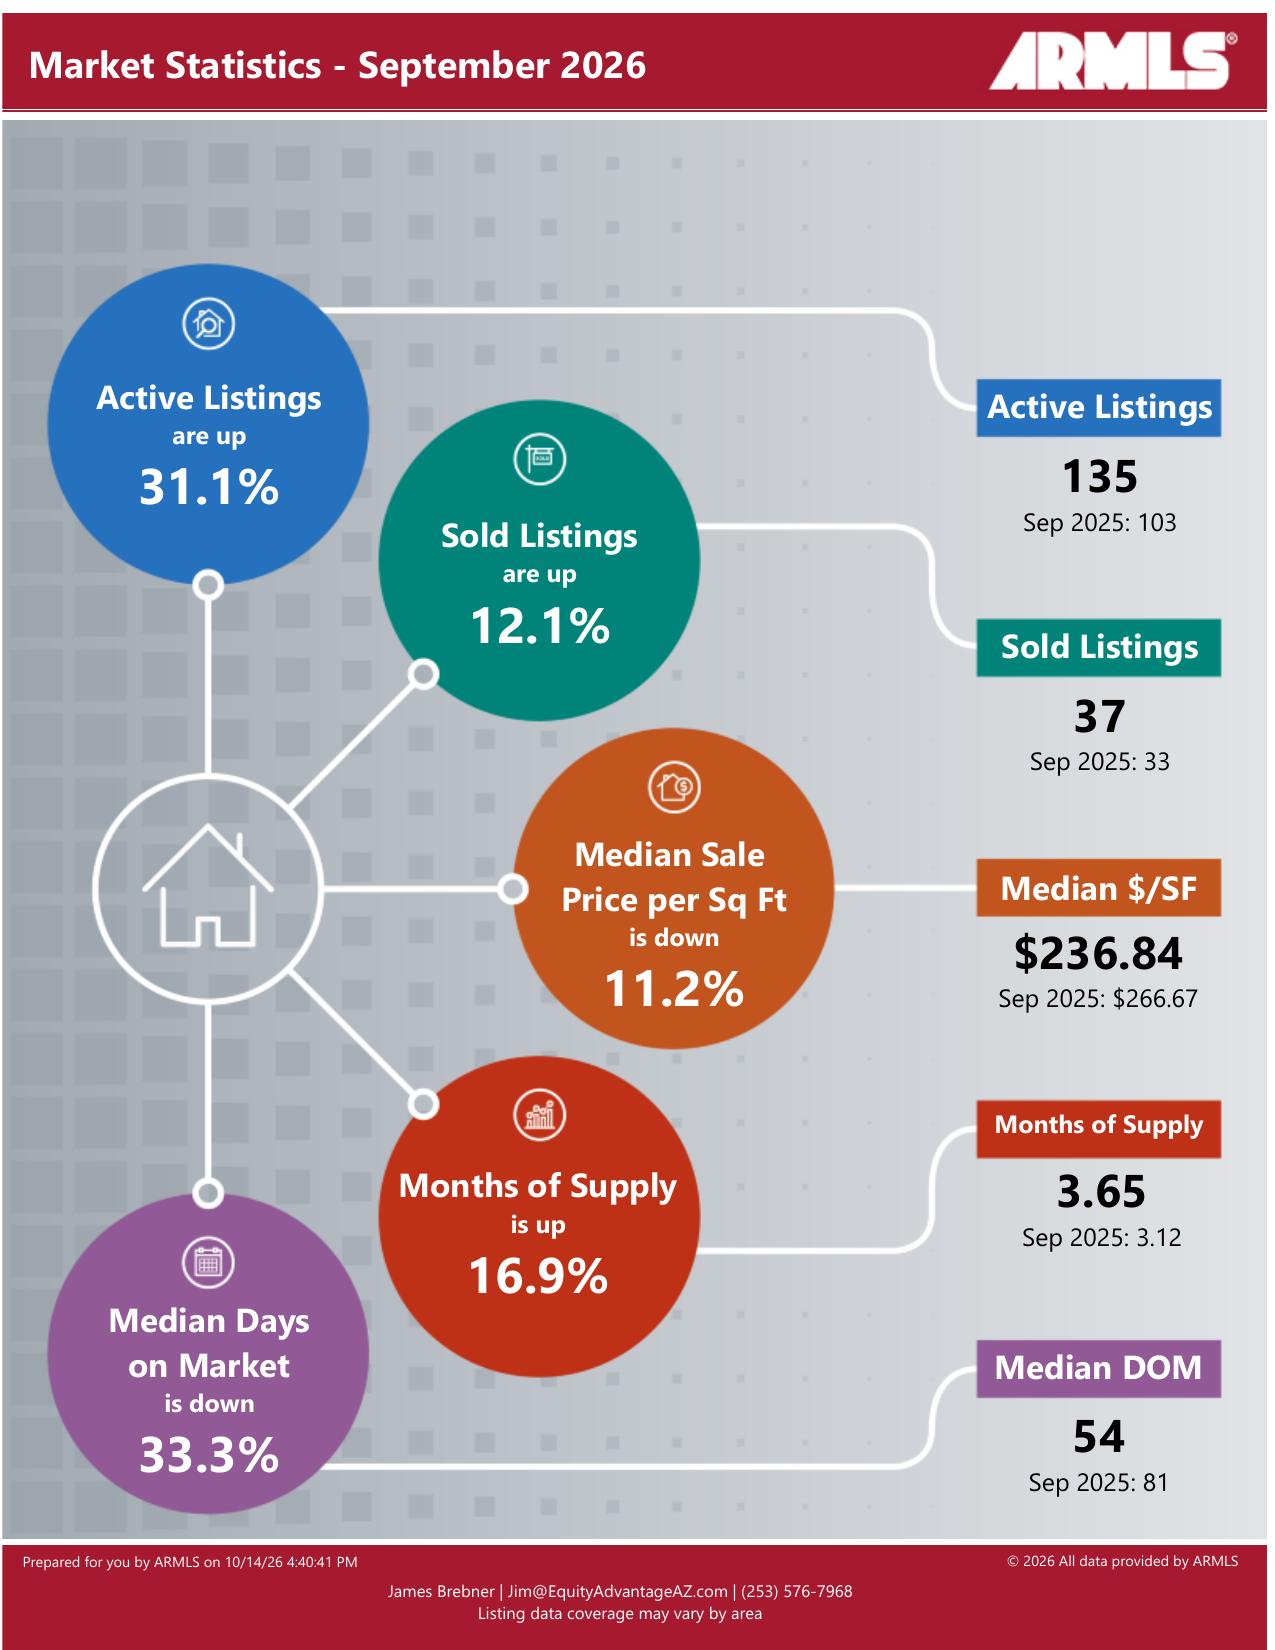
Inventory in The Grand grew sharply in September. There were 135 active listings, up 31.1% from 103 in September 2025, and 69 new listings came to market, up 60.47% from August. Supply rose to 3.65 months, compared with 3.12 months a year earlier.
Sales held up. 37 homes sold, up from 33 last September and 31 in August, and the median days on market fell to 54 from 81 a year ago. The median sale price was $435,000, up 16% from August, while the median price per square foot was $236.84, down 11.2% year over year. Monthly medians move with the size and type of homes that happen to sell, so neither figure tells you what your own home is worth.
Jim's Take
Only 19 properties went under contract in September, down from 37 in August. For buyers, more listings mean more choice and room to negotiate. For sellers, pricing and condition matter more than ever, because buyers have many similar homes to compare.
Written by Jim Brebner, REALTOR® with Realty ONE Group. Figures are taken from the MLS for The Grand in Surprise, Arizona and are deemed reliable but not guaranteed.
What is your home in The Grand worth today?
Community medians don't price your home. Ask me for a free, home-specific value review based on your floor plan, condition and the homes you would be competing against right now.
August 2026
The Grand Market Update - August 2026
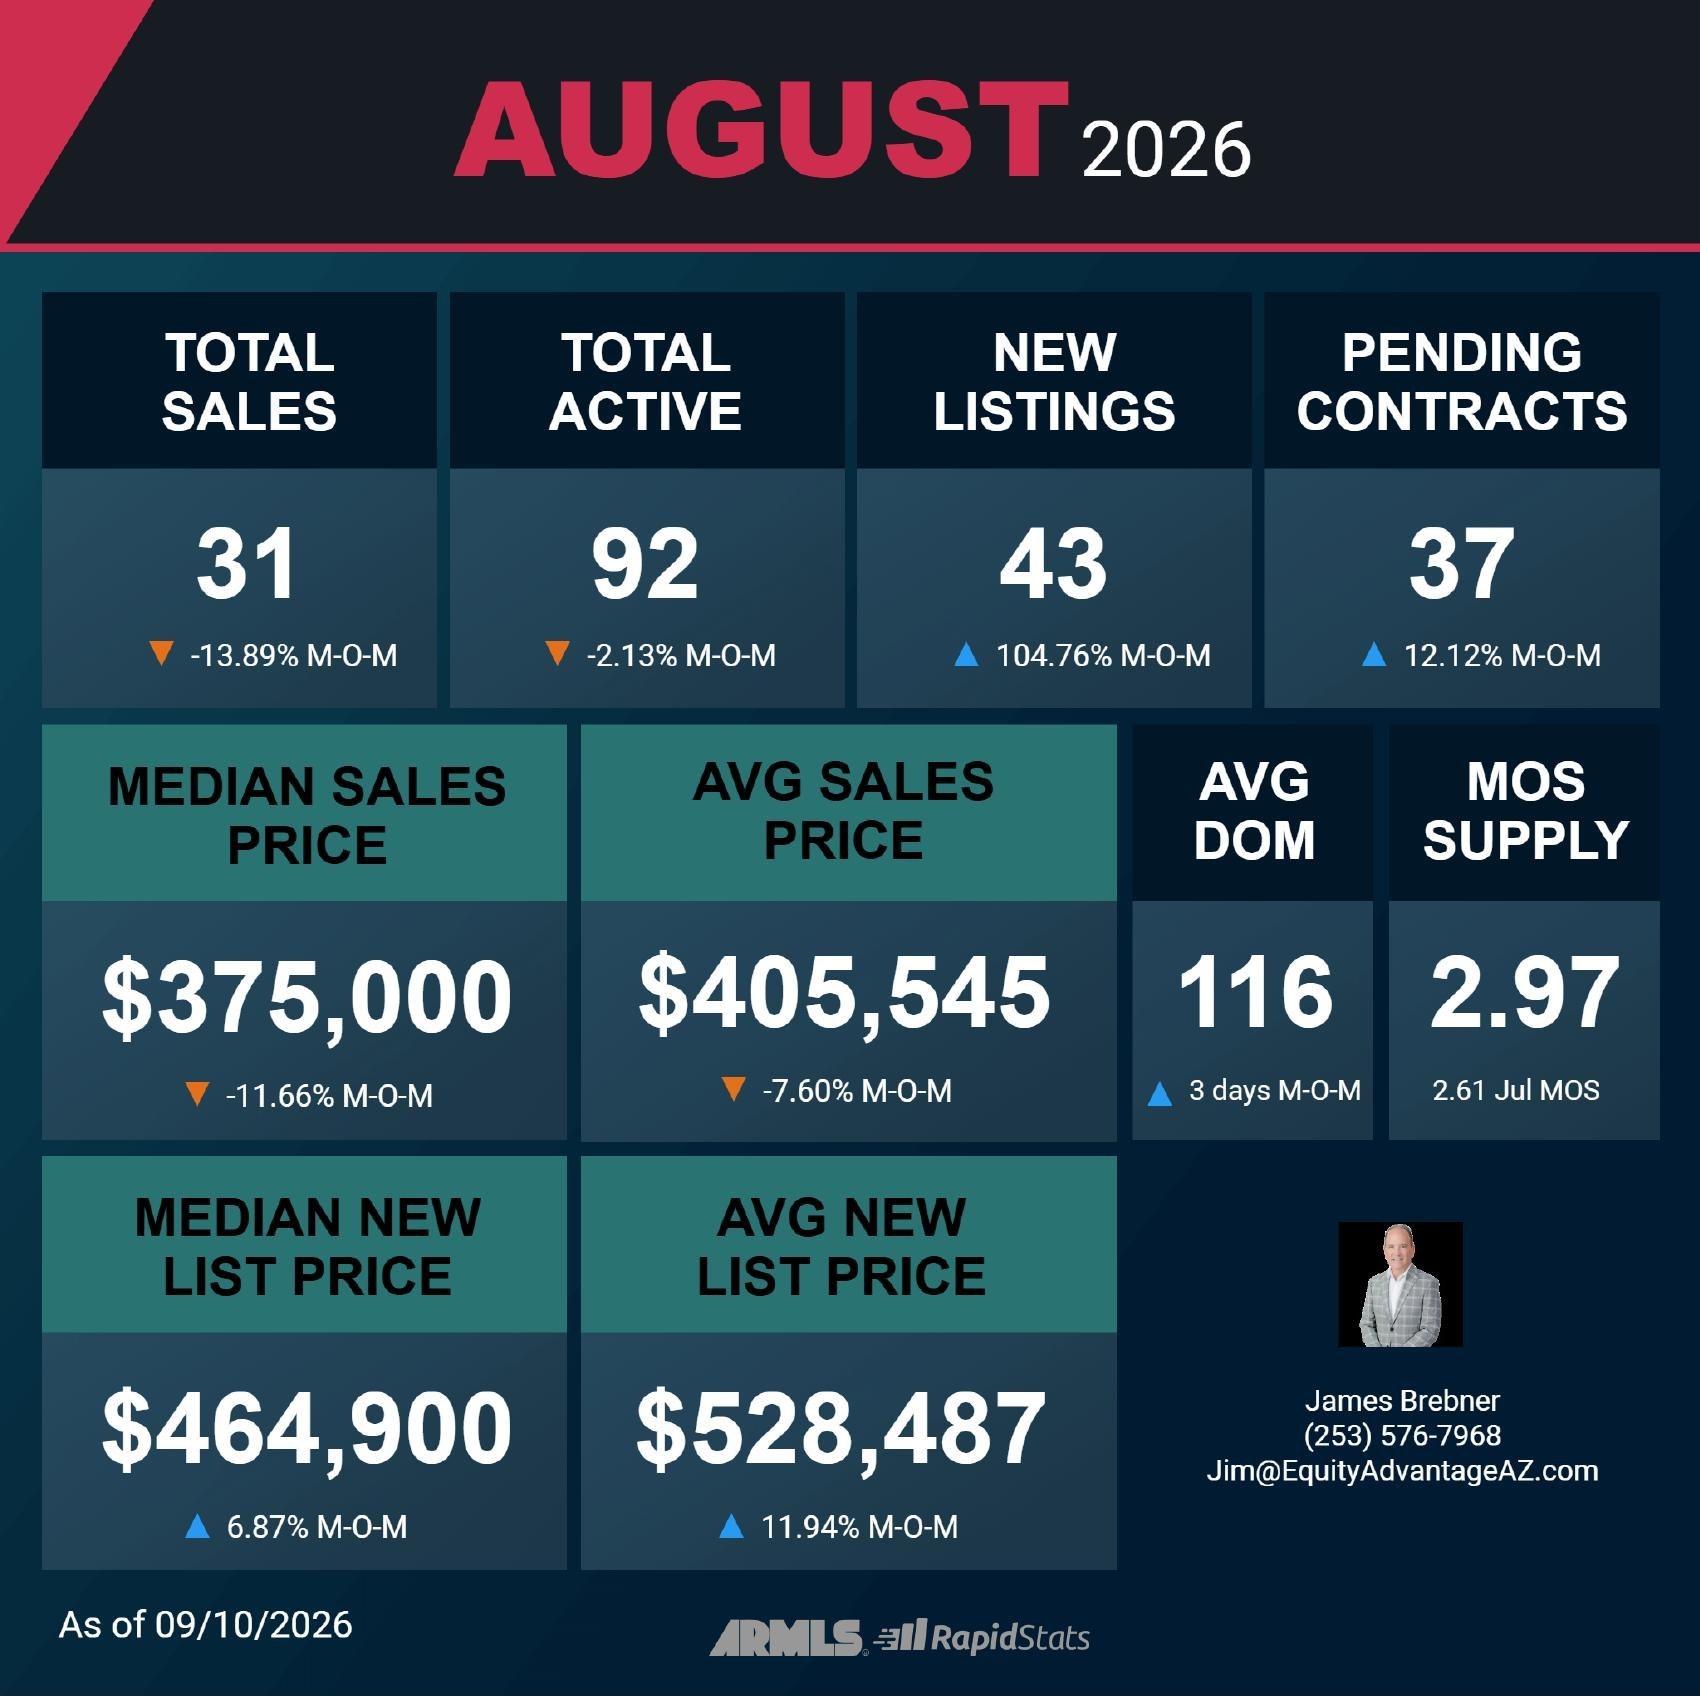
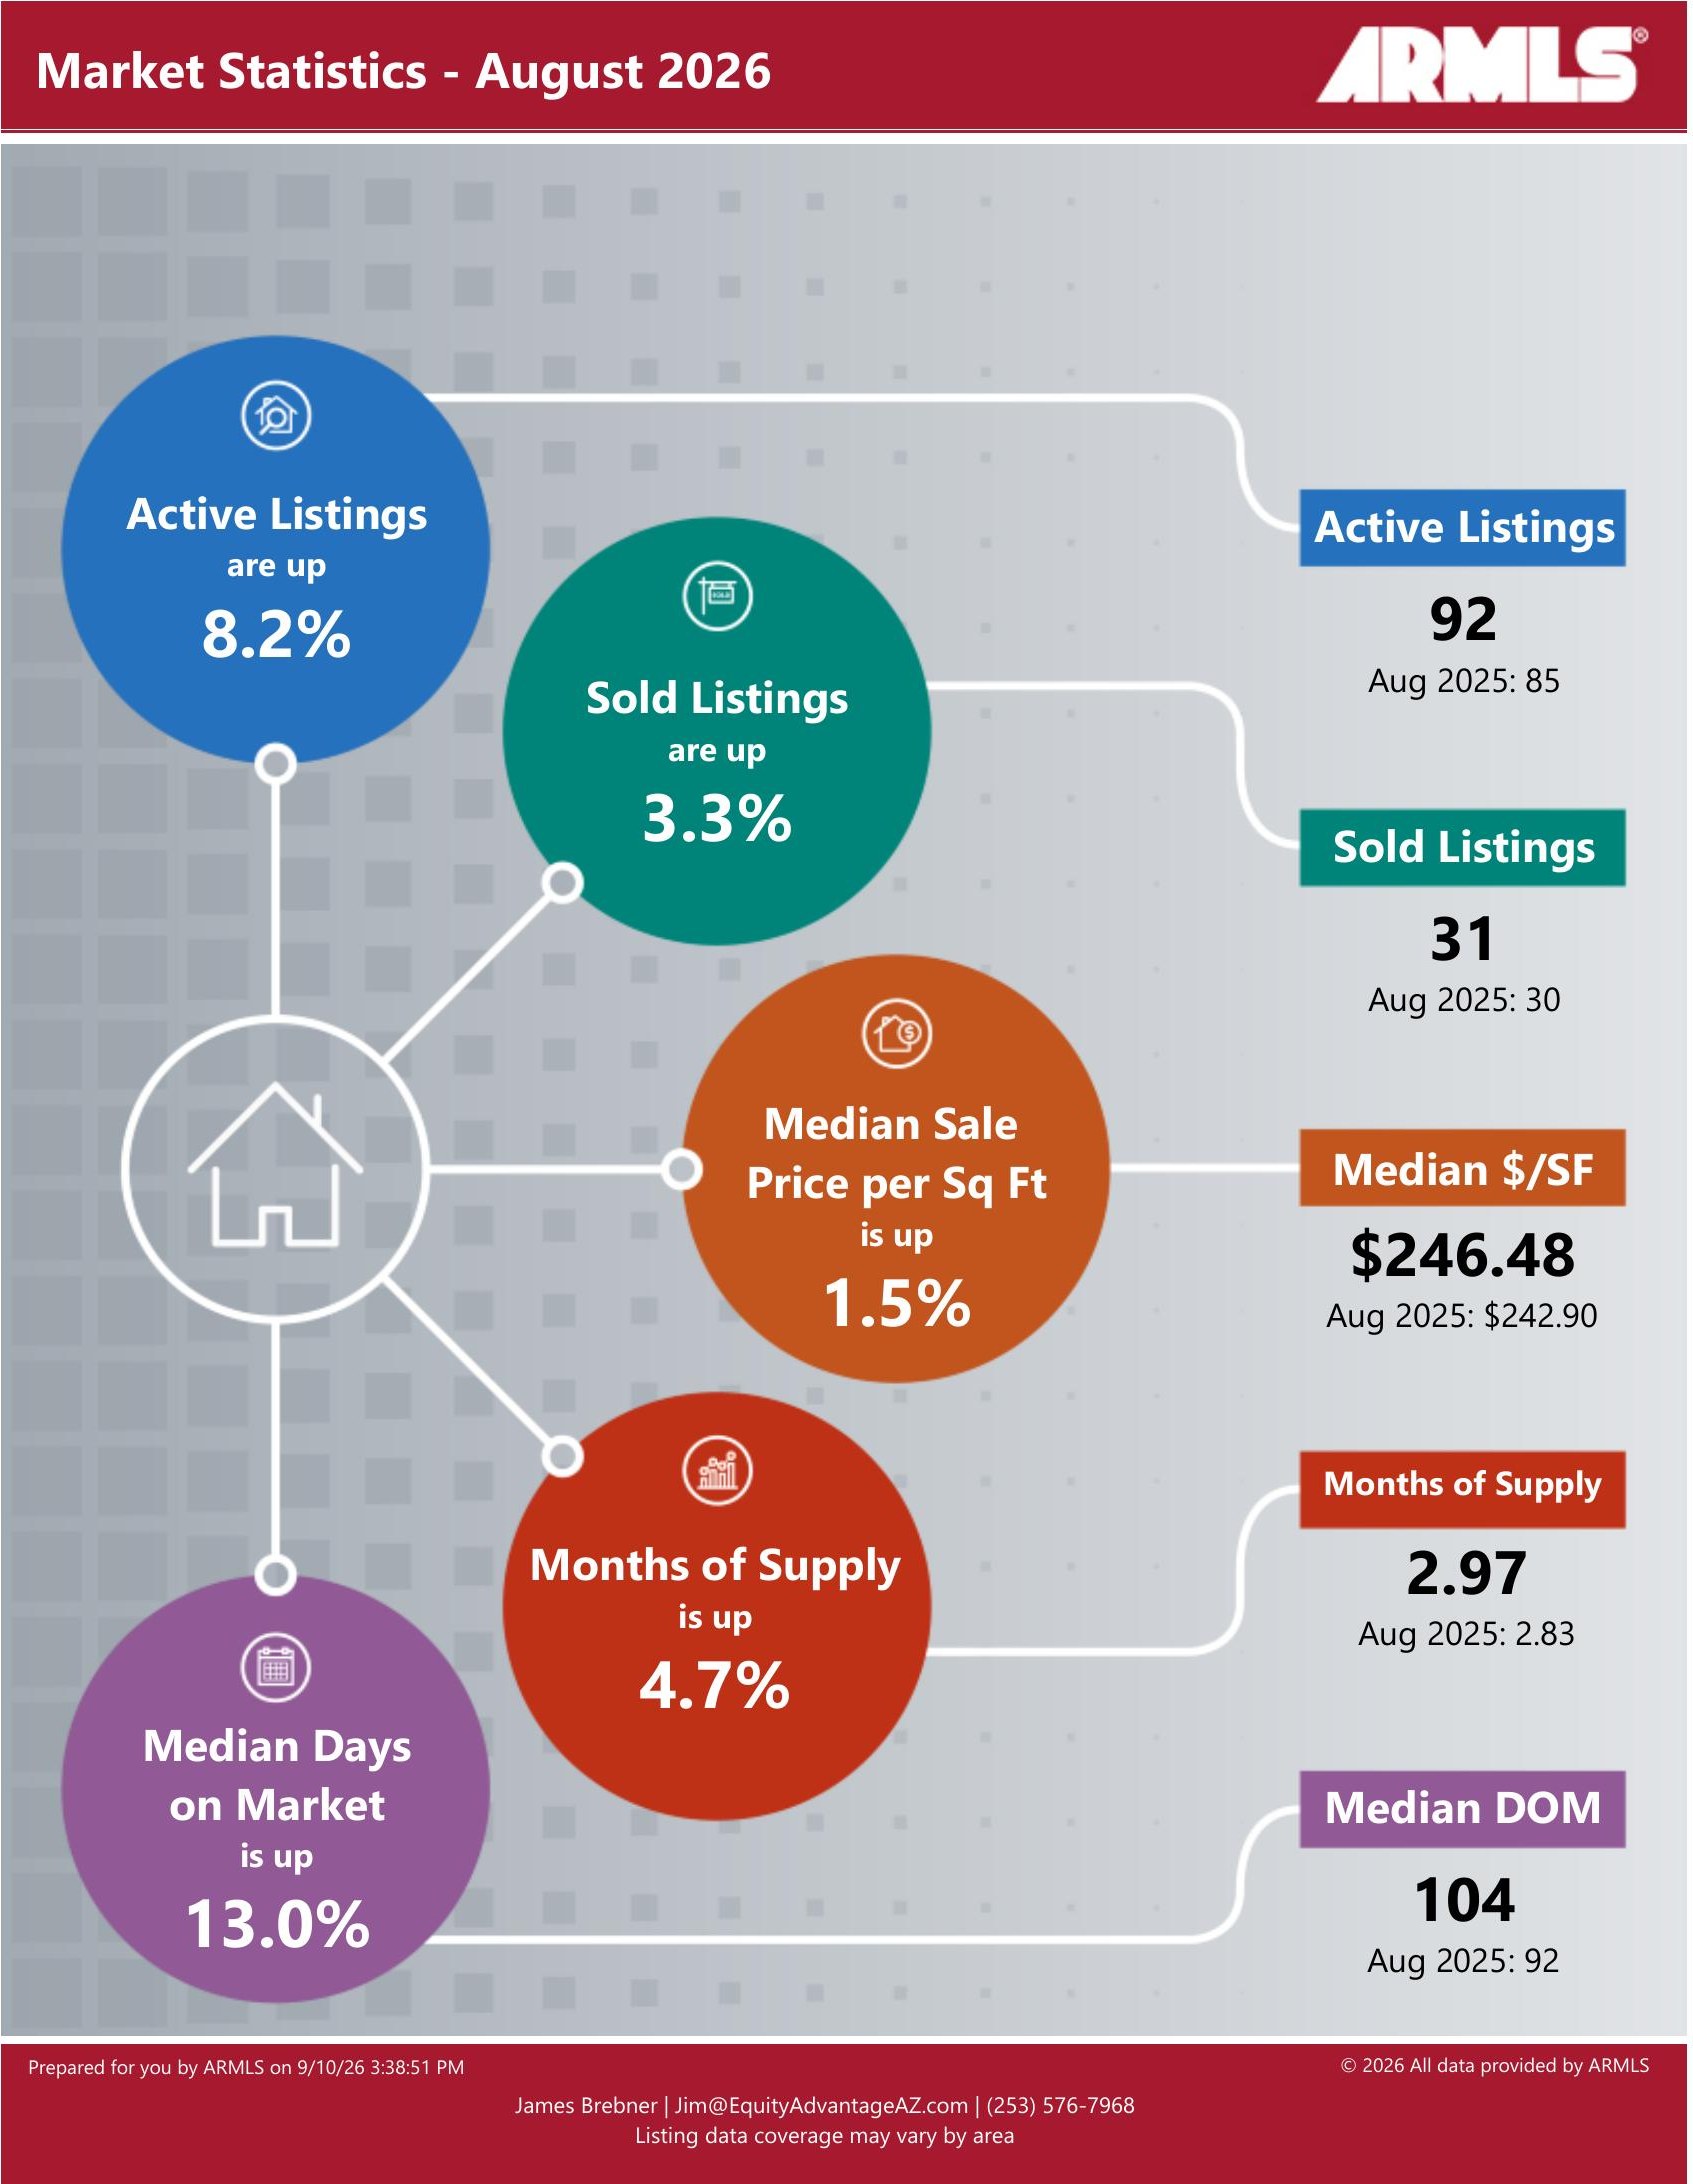
The Grand remained active in August, but buyers generally had more time and choice than they did one year ago. There were 92 active listings, up 8.2% from August 2025, while the available supply increased to 2.97 months. Homes also took longer to sell, with a median of 104 days on the market compared with 92 days last August. Meanwhile, 31 homes sold during the month, nearly unchanged from the 30 sales recorded one year earlier. The median price per square foot increased 1.5% year over year to $246.48, showing that home values continued to hold reasonably well despite the slower pace.
For buyers, the additional inventory and longer selling times may create more opportunities to compare homes, negotiate terms and make a thoughtful decision. For sellers, the market is still producing sales, but pricing and presentation are especially important when buyers have more choices. The median August sale price was $375,000, although that figure was down 11.66% from July. Because monthly median prices can change based on the size and type of homes sold, homeowners should not assume their property declined by the same amount. A home-specific market analysis remains the best way to determine current value.
One additional note: 43 new listings came to market during August, more than double July's total, while 37 properties went under contract. That tells us fresh inventory is arriving, but buyer activity is still present. The market is offering opportunity on both sides, but successful decisions will depend heavily on the individual home, its condition, location within The Grand and how accurately it is priced.
Written by Jim Brebner, REALTOR® with Realty ONE Group. Figures are taken from the MLS for The Grand in Surprise, Arizona and are deemed reliable but not guaranteed.
12-month trend
The Grand over the last 12 months
Here is how the market inside The Grand moved from November 2025 through October 2026. Spring was the busiest selling season, with 64 sales in March and 62 in April, while supply ranged from 2.61 months in July to 7.48 months in October.
| Month | Active listings | Homes sold | Median $/sq ft | Months of supply | Median days on market |
|---|---|---|---|---|---|
| October 2026 | 187 | 25 | $237.33 | 7.48 | 29 |
| September 2026 | 135 | 37 | $236.84 | 3.65 | 54 |
| August 2026 | 92 | 31 | $246.48 | 2.97 | 104 |
| July 2026 | 94 | 36 | $231.96 | 2.61 | 78 |
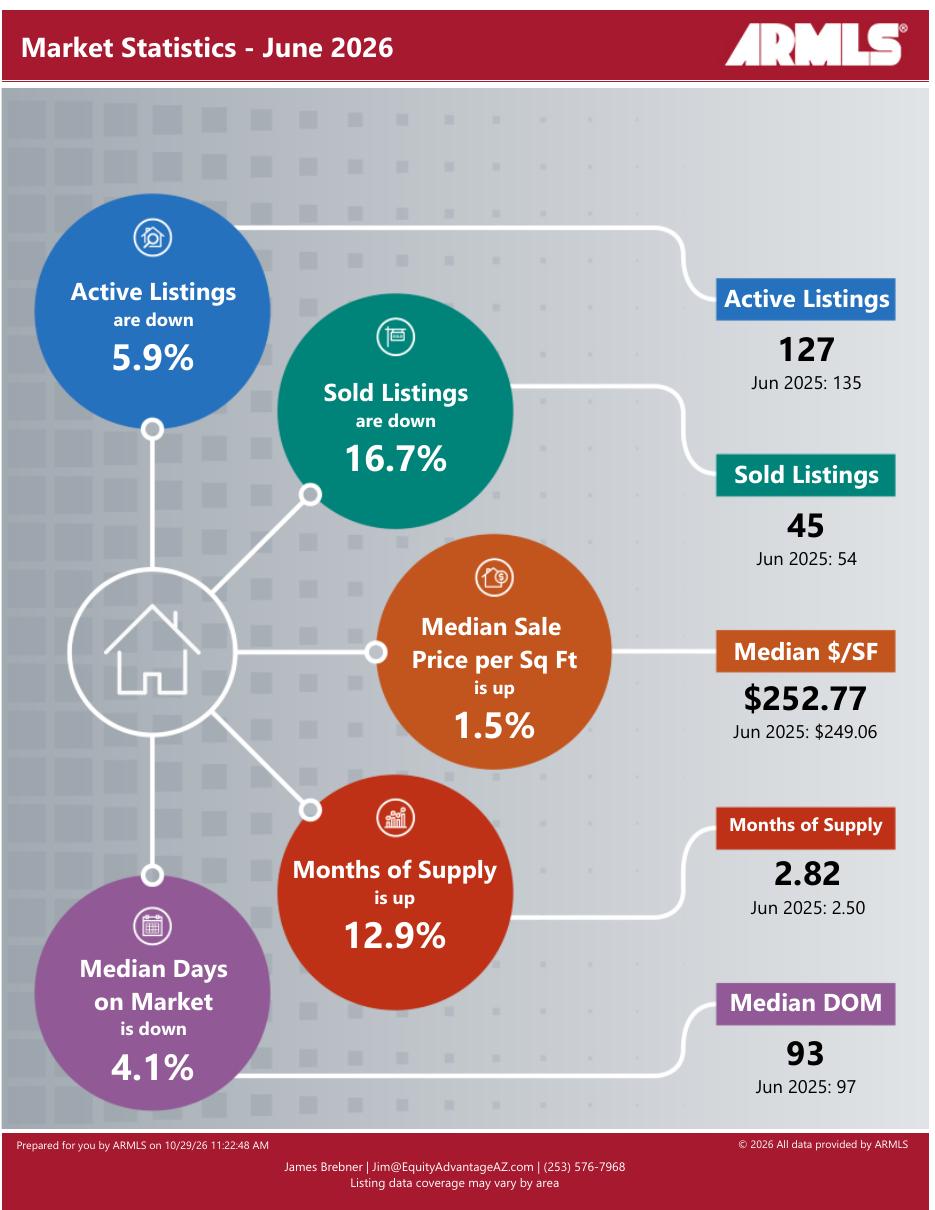
| June 2026 | 127 | 45 | $252.77 | 2.82 | 93 |
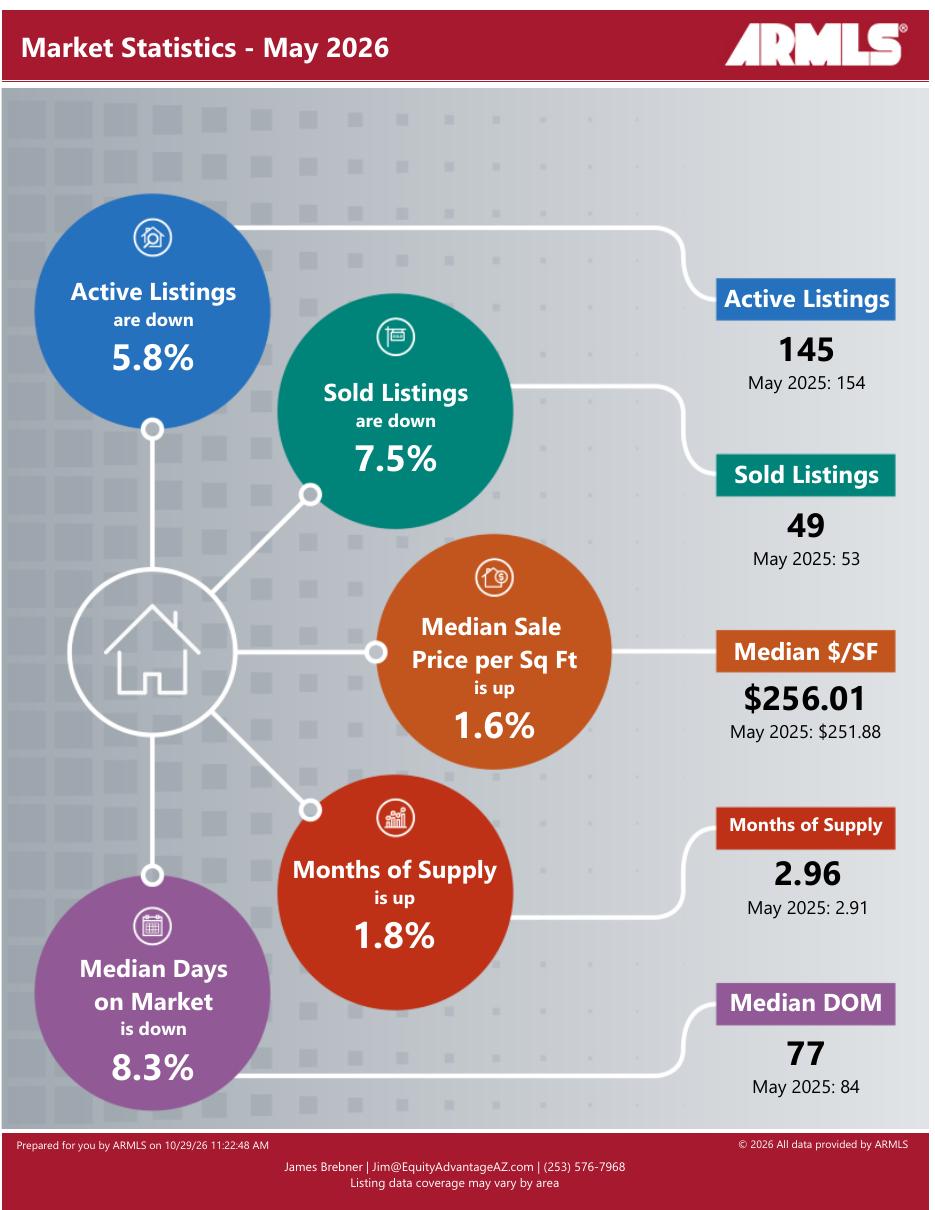
| May 2026 | 145 | 49 | $256.01 | 2.96 | 77 |
| April 2026 | 164 | 62 | $248.46 | 2.65 | 84 |
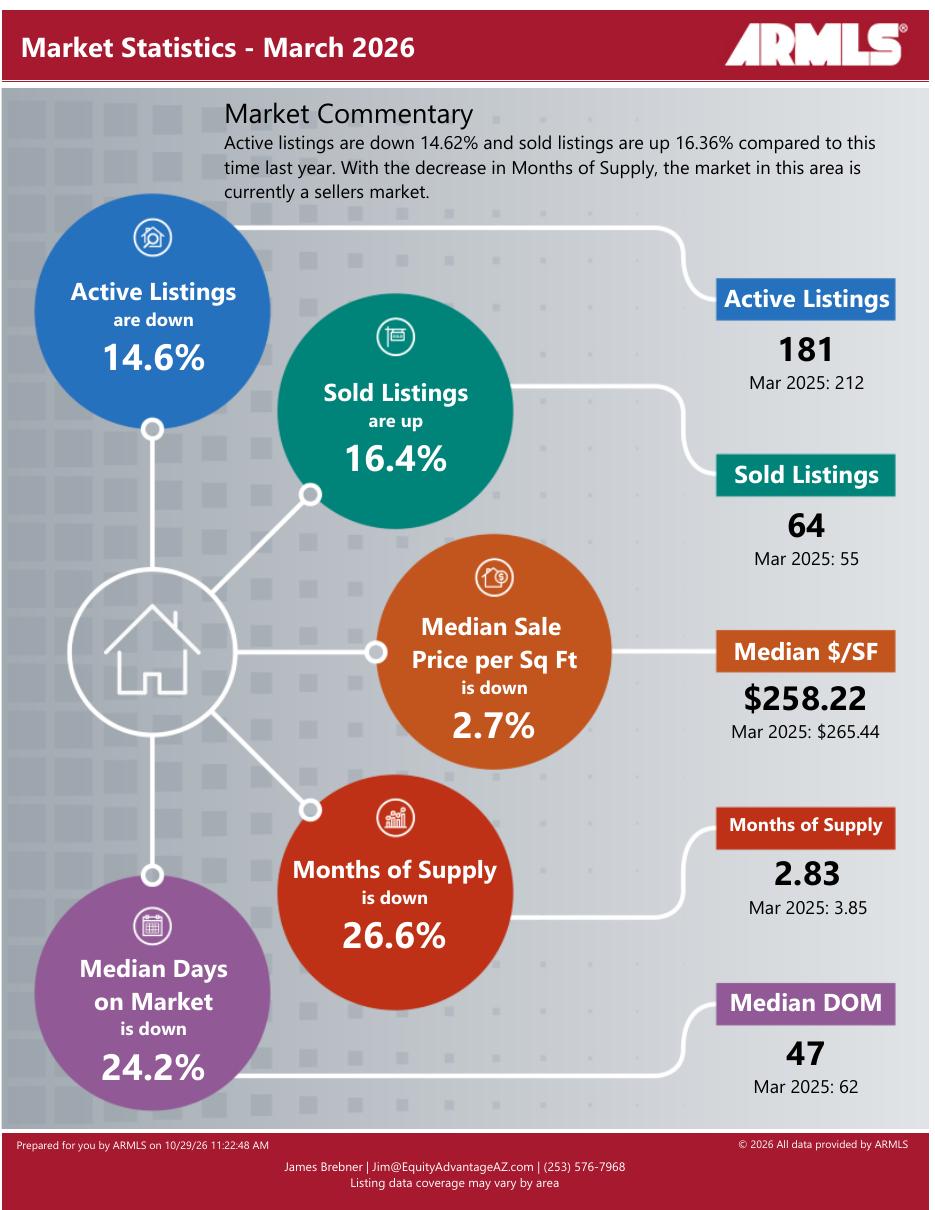
| March 2026 | 181 | 64 | $258.22 | 2.83 | 47 |
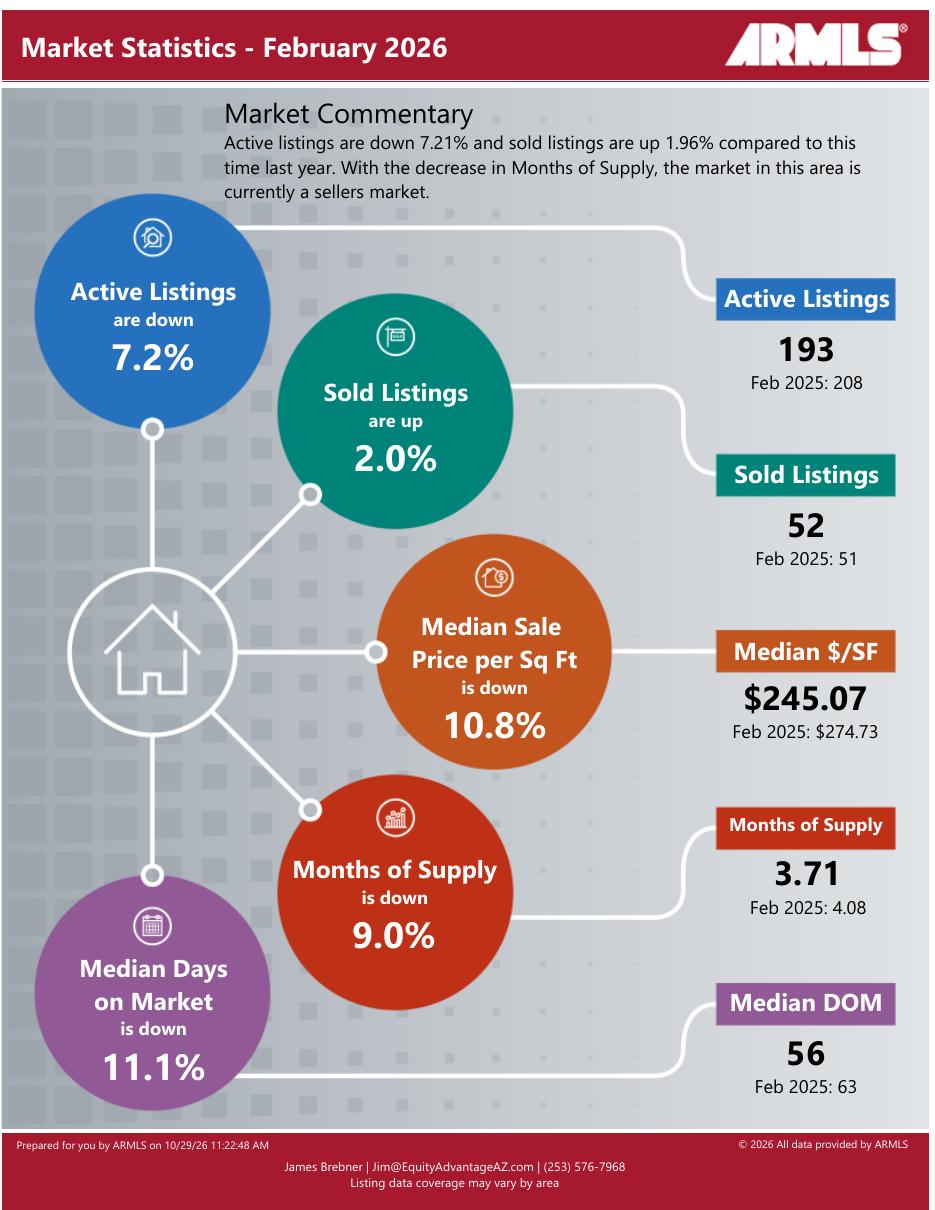
| February 2026 | 193 | 52 | $245.07 | 3.71 | 56 |
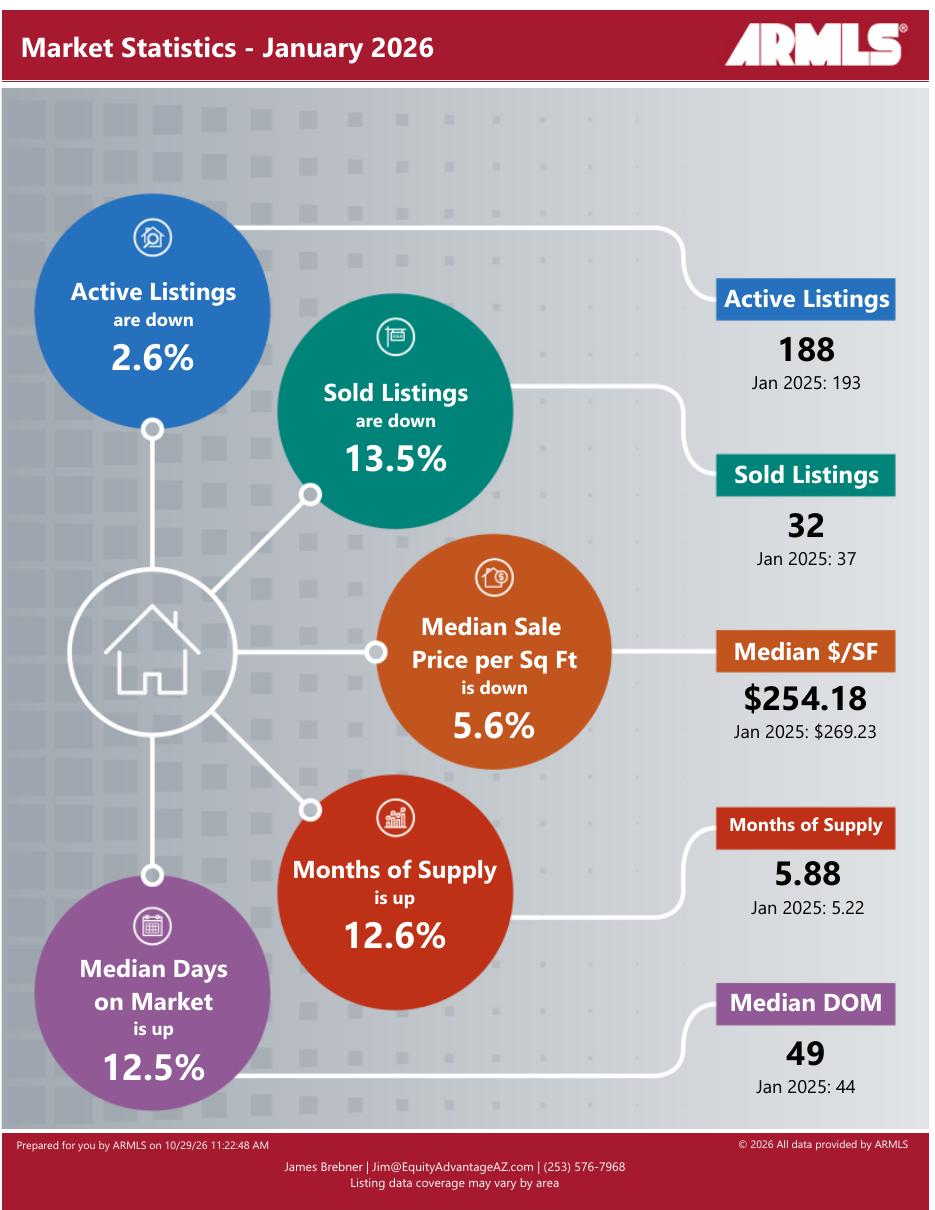
| January 2026 | 188 | 32 | $254.18 | 5.88 | 49 |
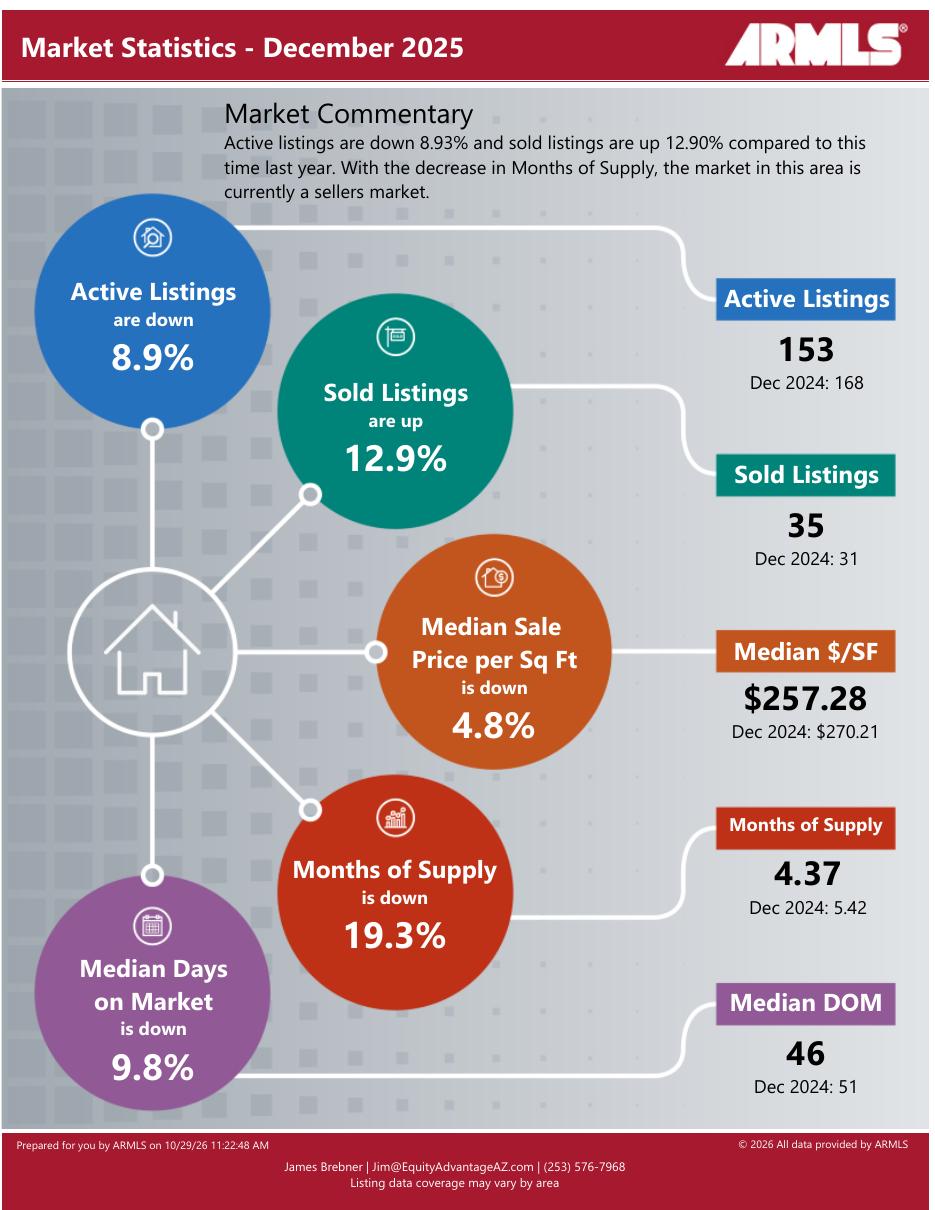
| December 2025 | 153 | 35 | $257.28 | 4.37 | 46 |
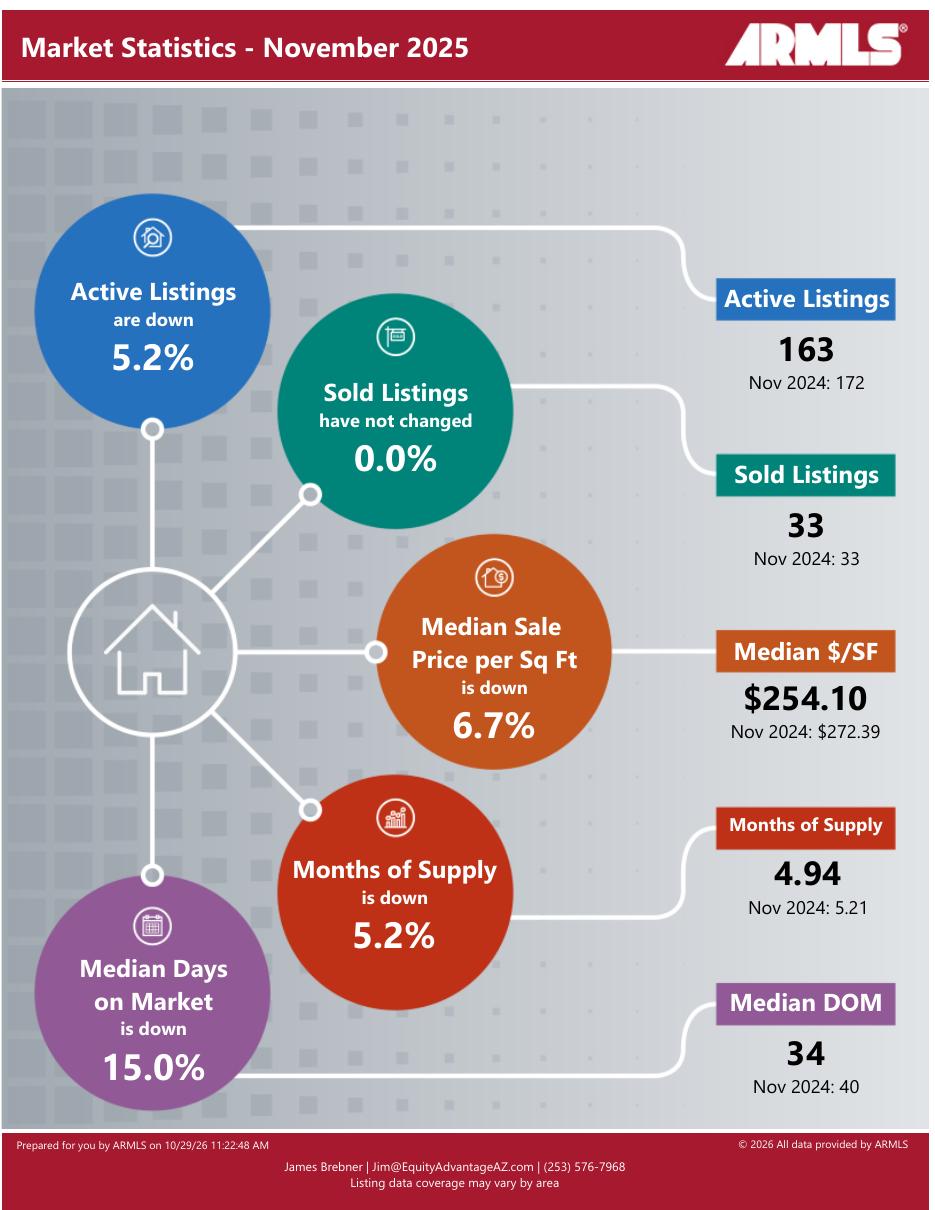
| November 2025 | 163 | 33 | $254.10 | 4.94 | 34 |
Archive
Previous monthly reports
Tap a month to see the full ARMLS report.
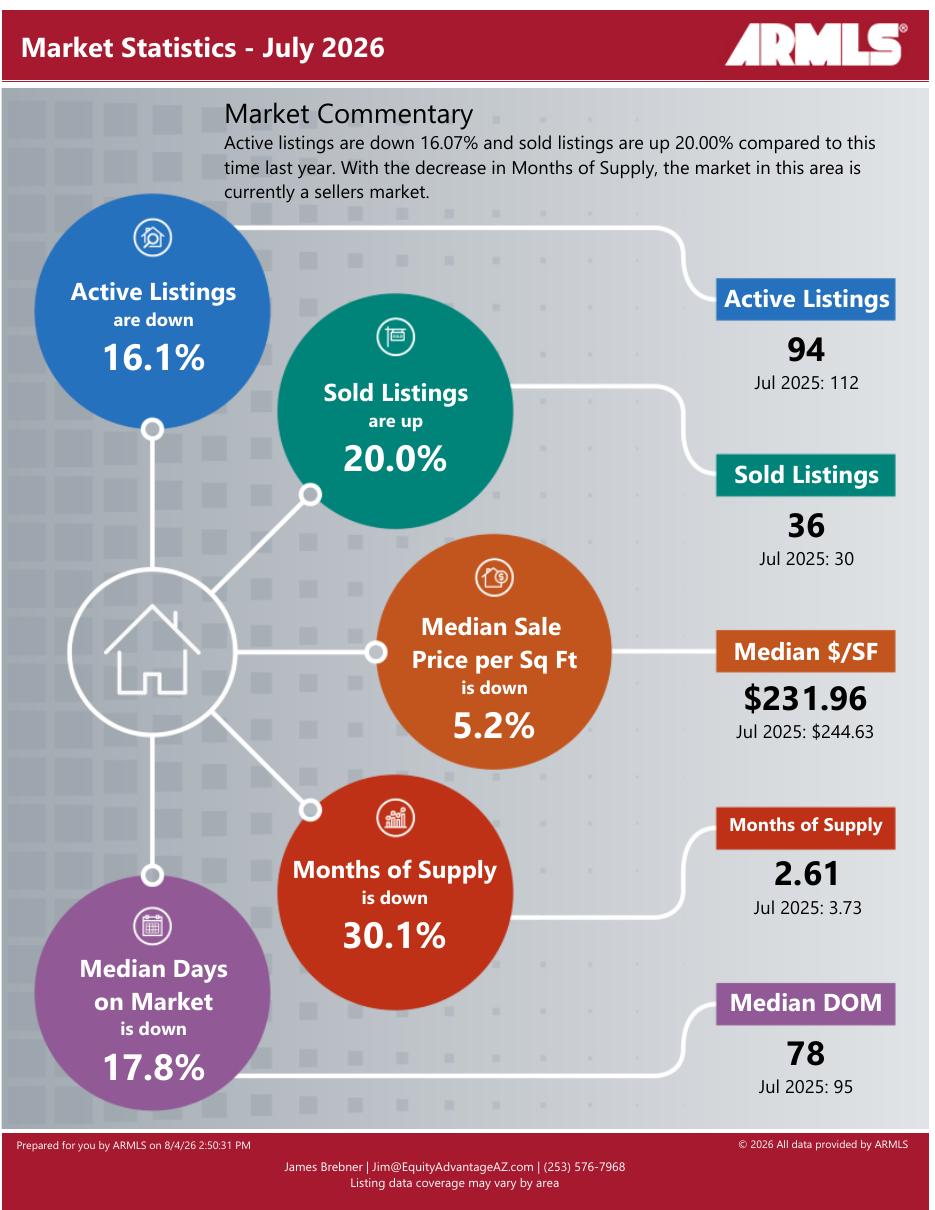
July 2026 · 94 active, 36 sold, 2.61 months of supply
Data provided by ARMLS. Deemed reliable but not guaranteed.
June 2026 · 127 active, 45 sold, 2.82 months of supply
Data provided by ARMLS. Deemed reliable but not guaranteed.
May 2026 · 145 active, 49 sold, 2.96 months of supply
Data provided by ARMLS. Deemed reliable but not guaranteed.
April 2026 · 164 active, 62 sold, 2.65 months of supply
Data provided by ARMLS. Deemed reliable but not guaranteed.
March 2026 · 181 active, 64 sold, 2.83 months of supply
Data provided by ARMLS. Deemed reliable but not guaranteed.
February 2026 · 193 active, 52 sold, 3.71 months of supply
Data provided by ARMLS. Deemed reliable but not guaranteed.
January 2026 · 188 active, 32 sold, 5.88 months of supply
Data provided by ARMLS. Deemed reliable but not guaranteed.
December 2025 · 153 active, 35 sold, 4.37 months of supply
Data provided by ARMLS. Deemed reliable but not guaranteed.
November 2025 · 163 active, 33 sold, 4.94 months of supply
Data provided by ARMLS. Deemed reliable but not guaranteed.
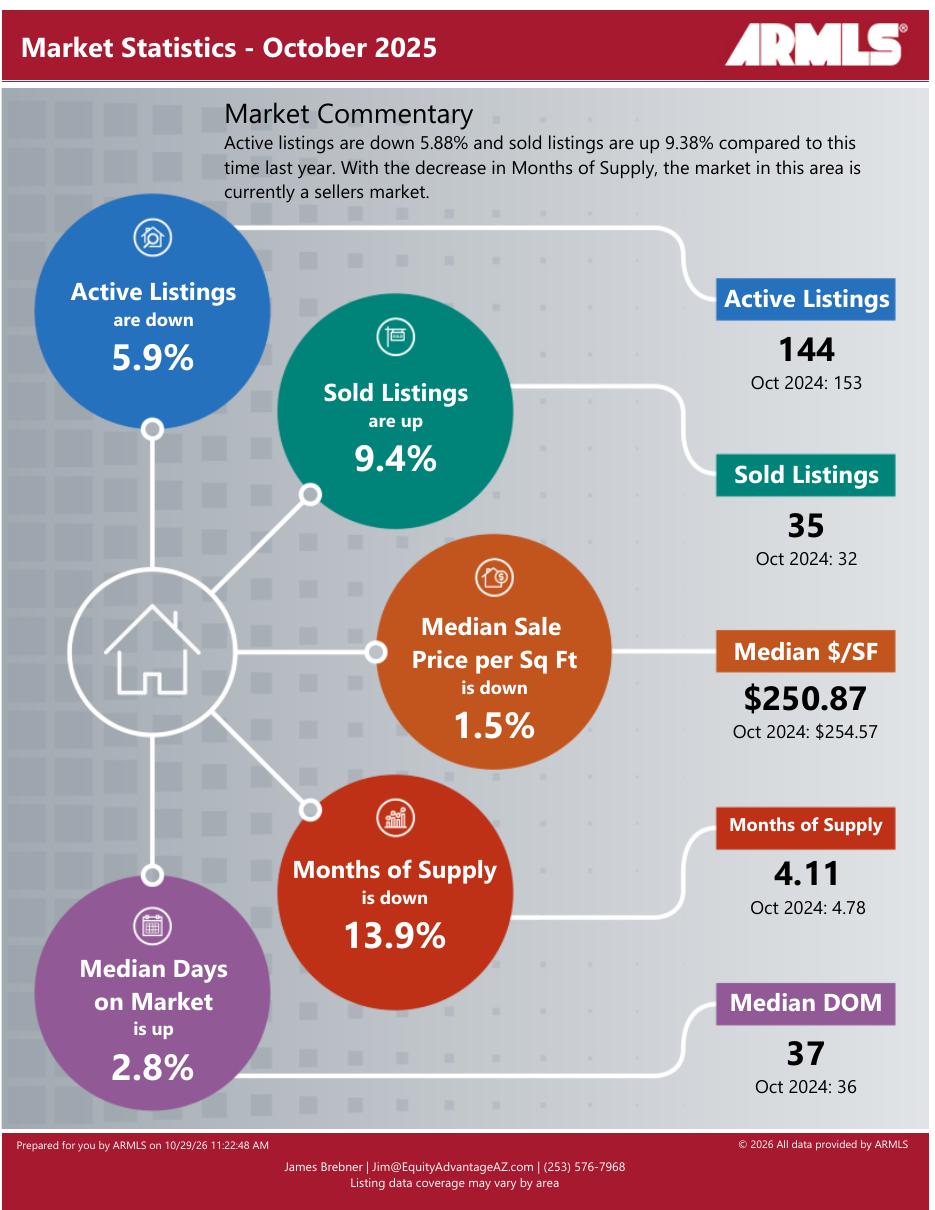
October 2025 · 144 active, 35 sold, 4.11 months of supply
Data provided by ARMLS. Deemed reliable but not guaranteed.
Thinking about selling?
A median number describes the whole community, not your home. I will walk your property, compare it to recent sales and current competition in The Grand, and tell you what I think it will actually sell for.
Buying in The Grand?
More inventory means more room to be selective. Start with the full guide to The Grand and the buyer resources, then call 623-244-9777 with your questions.
Data use and attribution
Market statistics on this page are provided by ARMLS and are deemed reliable but not guaranteed. You are welcome to quote or reference these figures for non-commercial purposes, provided you credit "Jim Brebner, REALTOR®, Equity Advantage (equityadvantageaz.com), data provided by ARMLS" and include the report month. This report is not an appraisal and is not legal, tax or financial advice.